

Image Details
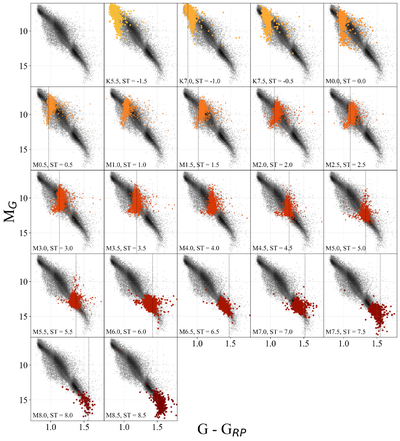
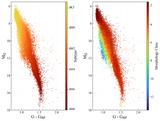
Caption: Figure 11.
The color–magnitude diagrams above highlight the distributions of stars in each ST in our classification scheme. The dashed black lines represent the G − GRP color of the given ST from M. J. Pecaut & E. E. Mamajek (2013). The colors from M. J. Pecaut & E. E. Mamajek (2013) do not line up exactly with the average ST colors from our work, though in some cases, the colors are very similar. K5.5 and K7.7 subtypes do not have colors listed in M. J. Pecaut & E. E. Mamajek (2013). The stars in each ST bin are well constrained to particular ranges in color for Pop I stars. In the subdwarf regime, the colors of each subtype shift slightly bluer, which is reflective of the lower opacity in subdwarf stars.
Other Images in This Article
Show More
Copyright and Terms & Conditions
© 2026. The Author(s). Published by the American Astronomical Society.

