Image Details
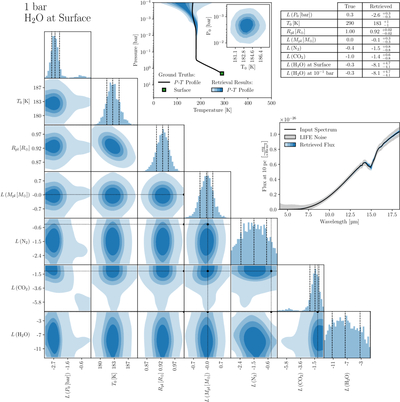
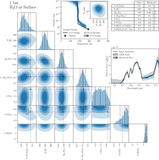
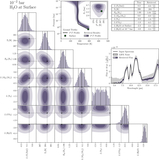
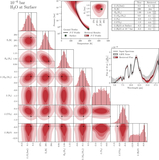
Caption: Figure 5.
Corner plot for the posterior distributions from the retrievals of a 1 bar surface H2O vertically constant profile model. The black dotted lines indicate the expected values. Abundances are reported as volume mixing ratios. The retrieved values are the dashed black lines (plotted both as the median and 1σ uncertainties) and are shown in the table with the expected values. L denotes log10. Top middle panel: the pressure–temperature profile with 2D histogram. Middle right panel: input versus retrieved spectra, with the gray shading showing the LIFESIM uncertainty (S/N = 10). The shaded contours represent 1σ–4σ confidence levels.
Other Images in This Article
Copyright and Terms & Conditions
© 2026. The Author(s). Published by the American Astronomical Society.