Image Details
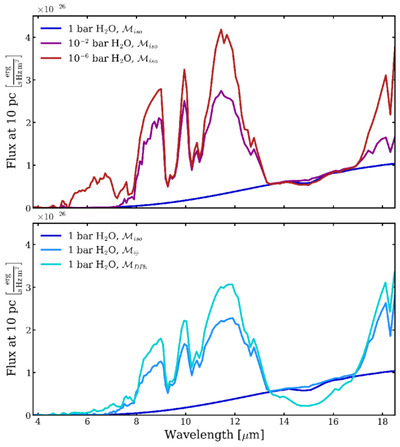
Caption: Figure 3.
Mid-IR input spectra at R=100 calculated by petitRADTRANS as input to LIFESIM for different H2O abundances and H2O profiles. The top panel shows three spectra for a vertically constant profile with surface H2O concentrations corresponding to a water-rich case of 1 bar (dark blue solid line), an Earth-like surface water case of 10−2 bar (purple line), and a water-poor Mars-like case of 10−6 bar (red line). The bottom panel shows a comparison between spectra with different water altitude profiles with the same surface water concentration of 1 bar for the altitude-invariant profile (dark blue), the Earth-like profile (blue), and the diffusion and photochemistry profile (light blue).
Other Images in This Article
Copyright and Terms & Conditions
© 2026. The Author(s). Published by the American Astronomical Society.