Image Details
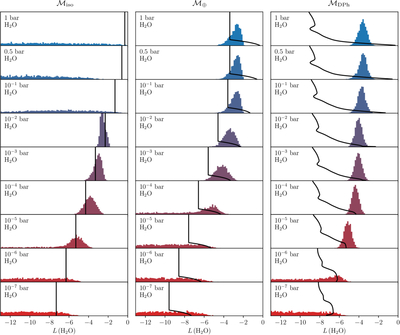
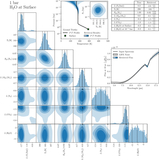
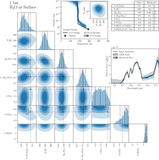
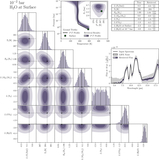
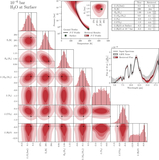
Caption: Figure 4.
Water posteriors for simulations for a range of surface H2O abundances from 1 bar to 10−7 bar at a resolution and S/N of R = 100 and S/N = 10, respectively. The black lines are the H2O profiles in volume mixing ratios in log10 (L) overlaying the H2O posteriors. The left panel assumes an altitude-invariant profile for water, commonly used in retrievals. The center panel fixes the surface abundance and then assumes a scaled Earth-like profile. The right panel fixes the surface H2O abundance and has diffusion and photochemical production at all other altitudes.
Other Images in This Article
Copyright and Terms & Conditions
© 2026. The Author(s). Published by the American Astronomical Society.
Copyright ©
2026 Astronomy Image Explorer. All Rights Reserved.