Image Details
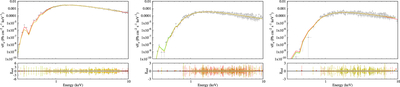
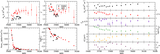
Caption: Figure 3.
Left to right: XRT2, XRT6, and XRT10 fitted unfolded spectra are presented for various models. The red line represents the Optxagnf model, green represents the Nthcomp model, and orange represents the powerlaw model. Corresponding residues are plotted in the bottom panels.
Other Images in This Article
Copyright and Terms & Conditions
© 2026. The Author(s). Published by the American Astronomical Society.
Copyright ©
2026 Astronomy Image Explorer. All Rights Reserved.