Image Details
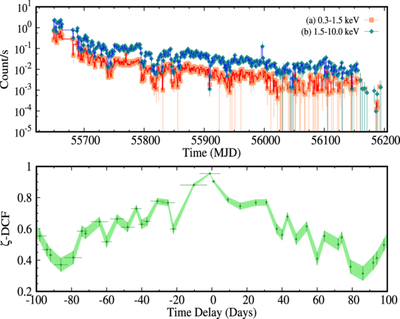
Caption: Figure 1.
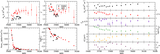
Upper panel: X-ray light curves of Swift J1644+57, obtained from the Swift/XRT, are presented for 0.3–1.5 keV (square, light salmon) and 1.5–10 keV energy bands (diamond, greenish-blue points). Lower panel: The ζ–DCF cross correlation between 0.3–1.5 keV and 1.5–10 keV ranges is presented for Swift J1644+57 using Swift/XRT data. Both the energy bands are highly correlated (ρmax = 0.95). Considering the error bars, no delay is observed between the two X-ray bands.
Other Images in This Article
Copyright and Terms & Conditions
© 2026. The Author(s). Published by the American Astronomical Society.
Copyright ©
2026 Astronomy Image Explorer. All Rights Reserved.