Image Details
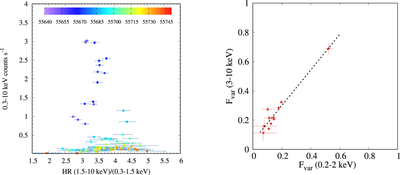
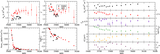
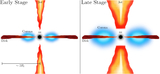
Caption: Figure 2.
Left panel: The hardness ratio of Swift J1644+57 is presented. The source exhibited hard spectra throughout the TDE. The color bar on top represents the MJD from the start of the event. Right panel: The correlated variability between 0.2–2 and 3–10 keV is observed from XMM-Newton data. The Pearson correlation coefficient is 0.96.
Other Images in This Article
Copyright and Terms & Conditions
© 2026. The Author(s). Published by the American Astronomical Society.
Copyright ©
2026 Astronomy Image Explorer. All Rights Reserved.