Image Details
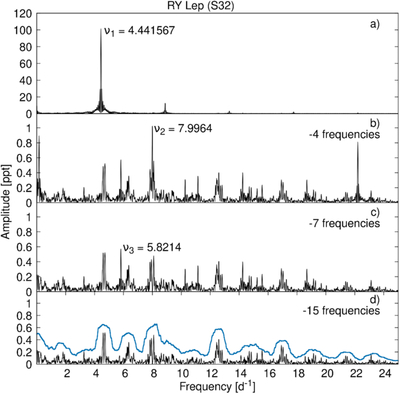
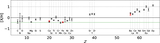
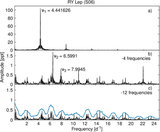
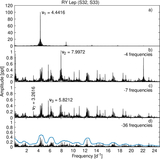
Caption: Figure B1.
Fourier amplitude periodograms of RY Lep derived from the TESS light curve in Sector S32. From top to bottom, the panels show: the periodogram for the original data, after subtracting four terms, after subtracting seven terms, and after subtracting 15 terms. The blue horizontal line marks the signal-to-noise ratio (S/N) threshold of 5.
Other Images in This Article
Show More
Copyright and Terms & Conditions
© 2026. The Author(s). Published by the American Astronomical Society.
Copyright ©
2026 Astronomy Image Explorer. All Rights Reserved.