Image Details
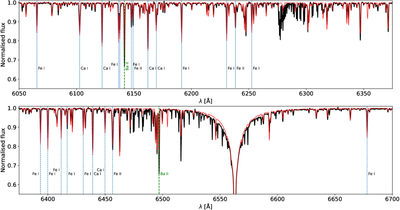
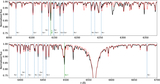
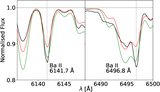
Caption: Figure 2.
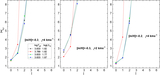
The normalized SALT spectrum of RY Lep is shown as a black line. The synthetic spectrum with Teff = 6750 K, ﹩\mathrm{log}g=3.5﹩, [m/H] = −0.4, ξ = 4 km s−1, and ﹩{V}_{{\rm{rot}}}\sin i=20﹩ km s−1 is shown as a red line. Vertical blue lines mark the wavelengths of Fe and Ca lines used to determine the overall metallicity, while the two green vertical lines indicate the positions of the Ba II spectral lines at 6141.7 and 6496.8 Å.
Other Images in This Article
Show More
Copyright and Terms & Conditions
© 2026. The Author(s). Published by the American Astronomical Society.
Copyright ©
2026 Astronomy Image Explorer. All Rights Reserved.