Image Details
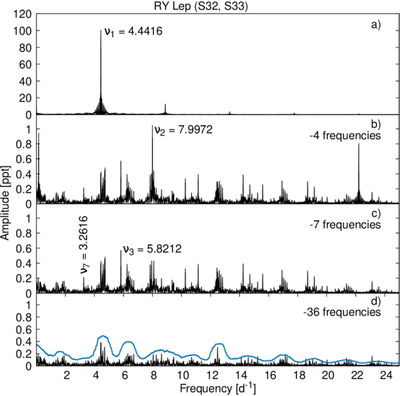
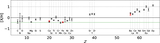
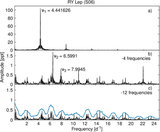
Caption: Figure 9.
Fourier amplitude periodograms derived from the TESS light curve of RY Lep from the combined S32 and S33 sectors. From top to bottom, the panels show the periodogram for the original data, after subtracting four terms, after subtracting seven terms, and after subtracting 36 terms. The blue horizontal line marks the S/N threshold of 5.
Other Images in This Article
Show More
Copyright and Terms & Conditions
© 2026. The Author(s). Published by the American Astronomical Society.
Copyright ©
2026 Astronomy Image Explorer. All Rights Reserved.