Image Details
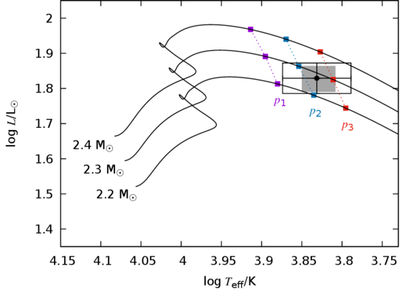
Caption: Figure 1.
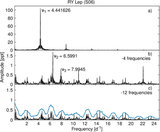
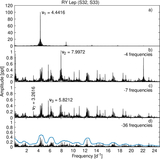
The Hertzsprung–Russell (H-R) diagram showing the position of RY Lep. The open box encompasses the whole range of Teff reported in the literature, while the gray box represents the values derived from our spectroscopic analysis. The evolutionary tracks were computed for X0 = 0.7, Z = 0.008, and Vrot,0 = 45 km s−1. Lines of constant frequency 4.4415 day−1 correspond to the radial fundamental mode (p1), first overtone (p2), and second overtone (p3).
Other Images in This Article
Show More
Copyright and Terms & Conditions
© 2026. The Author(s). Published by the American Astronomical Society.
Copyright ©
2026 Astronomy Image Explorer. All Rights Reserved.