Image Details
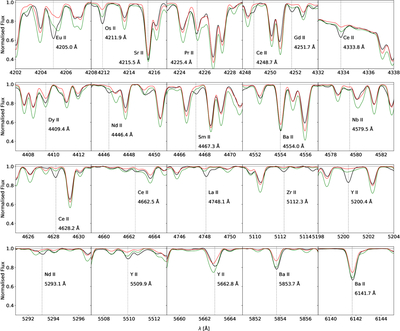
Caption: Figure A2.
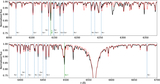
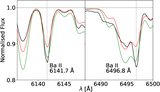
Spectral lines of chemical elements with Z > 30 showing overabundance, as observed in the SALT spectrum of RY Lep (black lines). The synthetic spectra were computed for Teff = 6878 K, ﹩\mathrm{log}g=3.51﹩, ﹩{V}_{{\rm{rot}}}\sin i=21.9﹩ km s−1, ξ = 4 km s−1, and two pairs of the metallicity [m/H] and abundance of α − elements [α/Fe]. The red line corresponds to [m/H]= −0.4, [α/Fe] = 0.1, and the green line to [m/H] = 0.0, [α/Fe] = 0.0.
Other Images in This Article
Show More
Copyright and Terms & Conditions
© 2026. The Author(s). Published by the American Astronomical Society.
Copyright ©
2026 Astronomy Image Explorer. All Rights Reserved.