Image Details
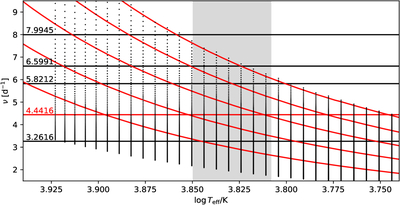
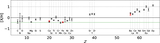
Caption: Figure 13.
Evolution of the frequencies of radial and dipole modes during the HSB phase, shown as a function of effective temperature, for a model with M = 2.4 M⊙, X0 = 0.7, Z = 0.008, Vrot, 0 = 45 km s−1, αMLT = 0.5, and αov = 0. Red lines denote radial modes (the lowest line corresponds to p1), and the small black dots show dipole axisymmetric modes (ℓ = 1, m = 0). Horizontal lines mark the frequencies observed in the TESS light curve; the dominant frequency at 4.4416 day−1 is shown in red. The shaded region marks the range of effective temperatures we derived from spectroscopy.
Other Images in This Article
Show More
Copyright and Terms & Conditions
© 2026. The Author(s). Published by the American Astronomical Society.
Copyright ©
2026 Astronomy Image Explorer. All Rights Reserved.