Image Details
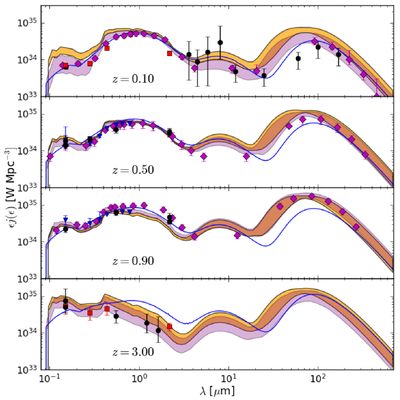
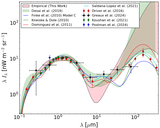
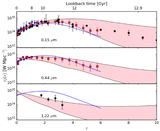
Caption: Figure 12.
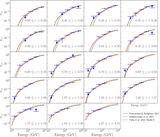
The orange region shows the 68% contour luminosity density results as a function of wavelength for four redshifts for our physically based model here; the redshifts (z) are labeled on the plots. The violet shaded region is the 68% contour result from J. D. Finke et al. (2022) Model B. The blue curve is the model from J. D. Finke et al. (2010), and the symbols are the same measurements in Figure 11; additionally, the purple diamonds indicate the data from S. K. Andrews et al. (2017).
Other Images in This Article
Show More
Copyright and Terms & Conditions
© 2026. The Author(s). Published by the American Astronomical Society.
Copyright ©
2026 Astronomy Image Explorer. All Rights Reserved.