Image Details
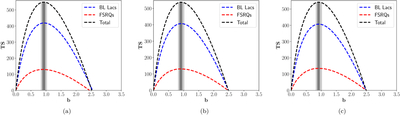
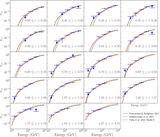
Caption: Figure 3.
TSEBL profiles of the EBL detection as a function of the renormalizing parameter b, for the EBL models of J. D. Finke et al. (2022, left), A. Saldana-Lopez et al. (2021, center), and A. Franceschini et al. (2008, right). The dark and light shaded regions show the 1σ and 2σ confidence intervals around the best-fit b values. The dashed red, blue, and black lines correspond to the FSRQ, BL Lac, and combined profiles, respectively. The best-fit parameters are reported in Table 2.
Other Images in This Article
Show More
Copyright and Terms & Conditions
© 2026. The Author(s). Published by the American Astronomical Society.
Copyright ©
2026 Astronomy Image Explorer. All Rights Reserved.