Image Details
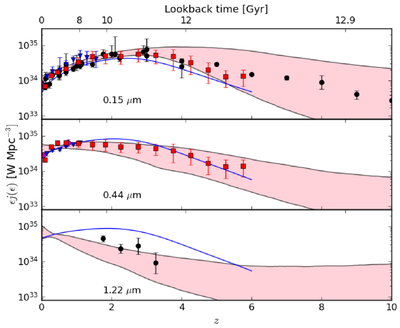
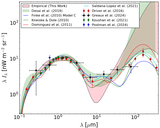
Caption: Figure 9.
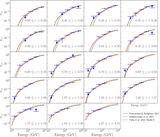
The 68% contour luminosity density results as a function of redshift for three wavelengths (labeled on the plots) for our empirical model here. The blue curve is the model from J. D. Finke et al. (2010) and the symbols show the measurements from A. Saldana-Lopez et al. (2021, red squares), L. Tresse et al. (2007, blue triangles), and other sources (black circles) described in J. D. Finke et al. (2022).
Other Images in This Article
Show More
Copyright and Terms & Conditions
© 2026. The Author(s). Published by the American Astronomical Society.
Copyright ©
2026 Astronomy Image Explorer. All Rights Reserved.