Image Details
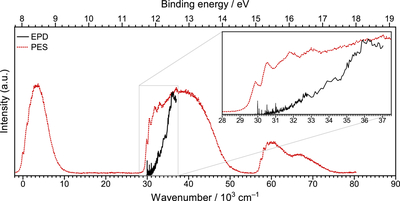
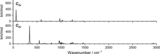
Caption: Figure 4.
PES spectrum of HMT (P. Crandall et al. 2024b) as a function of binding energy (top axis) compared to the EPD spectrum of HMT+ in wavenumber (bottom axis), relative to the Ei(a) of HMT (8.03 eV). The inset depicts an expanded view of the comparable bands assigned to the D3 state of HMT+.
Other Images in This Article
Copyright and Terms & Conditions
© 2026. The Author(s). Published by the American Astronomical Society.
Copyright ©
2026 Astronomy Image Explorer. All Rights Reserved.