Image Details
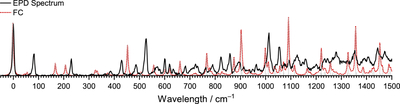
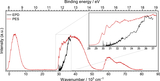
Caption: Figure 7.
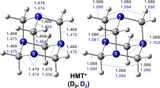
Franck–Condon (FC) simulation of the D3(2Aʹ)←D0(2Aʹ) transition of HMT+ (using optimized geometries of the D0 and D3 states with Cs symmetry—Figure 6; FWHM = 7 cm–1) compared to the experimental EPD spectrum as a function of the internal energy in the D3 state.
Other Images in This Article
Copyright and Terms & Conditions
© 2026. The Author(s). Published by the American Astronomical Society.
Copyright ©
2026 Astronomy Image Explorer. All Rights Reserved.