Image Details
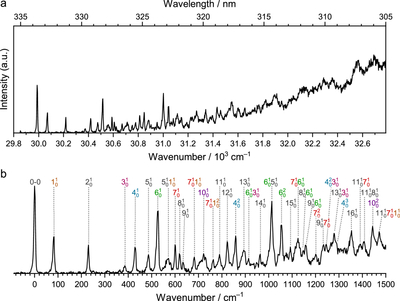
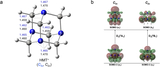
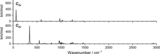
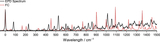
Caption: Figure 3.
(a) Total EPD spectrum of HMT+ between 29,850 and 32,790 cm–1 (305–335 nm). (b) EPD spectrum in the vicinity of the band origin of the D3 state as a function of internal energy, with suggested vibrational assignments (Table 2).
Other Images in This Article
Copyright and Terms & Conditions
© 2026. The Author(s). Published by the American Astronomical Society.
Copyright ©
2026 Astronomy Image Explorer. All Rights Reserved.