Image Details
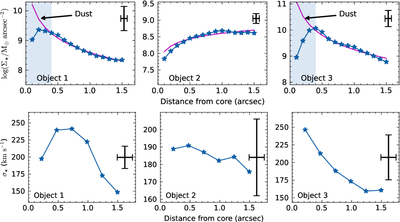
Caption: Figure 15.
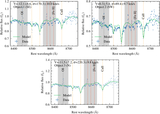
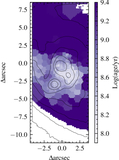
Top: stellar mass surface density profile for each core, fitted by power laws (magenta). The dips at small radii for objects 1 and 3 are due to heavy dust obscuration. Spatial resolution is ﹩\simeq \,0\mathop{.}\limits{^{\prime\prime} }05﹩. Bottom: stellar velocity dispersion radial distribution based on seeing-limited KCWI observation. We indicate the radial bin size and median standard deviation within each bin with reference error bars on the right of each subfigure. These measurements are consistent with objects 1 and 2 being tidally stripped satellites. While the values for object 2 in Figure 4 may appear inconsistent with those presented here, the discrepancy arises from the differing weighting methods employed; Figure 4 displays a flux-weighted spectrum, whereas the values in this section represent a direct spatial average of individual spaxels within each annulus.
Other Images in This Article
Show More
Copyright and Terms & Conditions
© 2026. The Author(s). Published by the American Astronomical Society.