Image Details
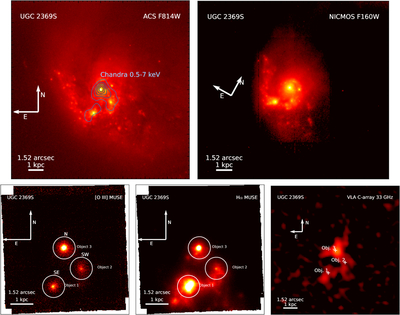
Caption: Figure 2.
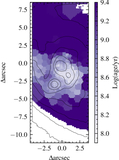
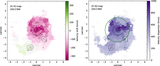
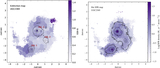
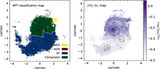
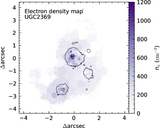
Multiwavelength observations of UGC 2369S. Top: HST ACS and NICMOS images. The contours overplotted on the ACS image indicate the Chandra 0.5−7 keV X-ray emission. The Chandra counts have been convolved with a Gaussian of σ = 0﹩\mathop{.}\limits^{\unicode{x02033}}﹩25. Bottom: MUSE and VLA 33 GHz observations. Three cores are detected above 5σ. Circular apertures with 1﹩\mathop{.}\limits^{\unicode{x02033}}﹩5 diameter are indicated in MUSE pseudo-narrowband images, from which we extract spectra and estimate the stellar kinematics.
Other Images in This Article
Show More
Copyright and Terms & Conditions
© 2026. The Author(s). Published by the American Astronomical Society.
Copyright ©
2026 Astronomy Image Explorer. All Rights Reserved.