Image Details
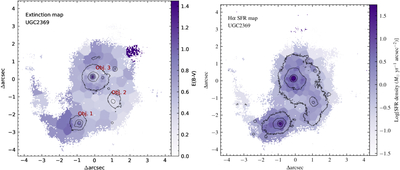
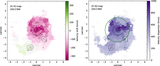
Caption: Figure 7.
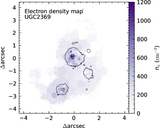
Left: extinction map calculated from Hα/Hβ line ratio. Increased extinction is observed at the centers of objects 1 and 3, indicating the presence of abundant dust at their cores. On the other hand, object 2 has no apparent peak in extinction. Right: extinction-corrected Hα SFR density.
Other Images in This Article
Show More
Copyright and Terms & Conditions
© 2026. The Author(s). Published by the American Astronomical Society.
Copyright ©
2026 Astronomy Image Explorer. All Rights Reserved.