Image Details
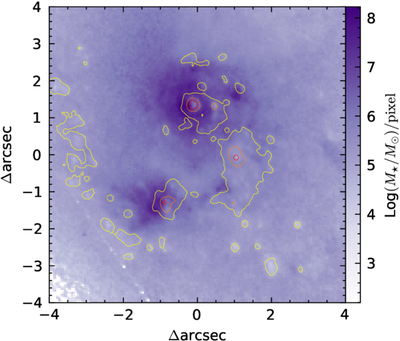
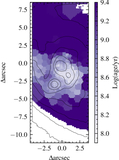
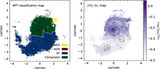
Caption: Figure 14.
Stellar mass map estimated from the g − i color and H-band magnitude, with the HST g-band (F435W) contour being overplotted. The western core shows a deficiency in stars, which is consistent with the relatively low dust extinction and SFR, indicating a history of tidal disruption. Note that this method tends to underestimate the stellar mass in dusty regions, due to the power-law scaling between the g − i color and mass-to-light ratio.
Other Images in This Article
Show More
Copyright and Terms & Conditions
© 2026. The Author(s). Published by the American Astronomical Society.
Copyright ©
2026 Astronomy Image Explorer. All Rights Reserved.