Image Details
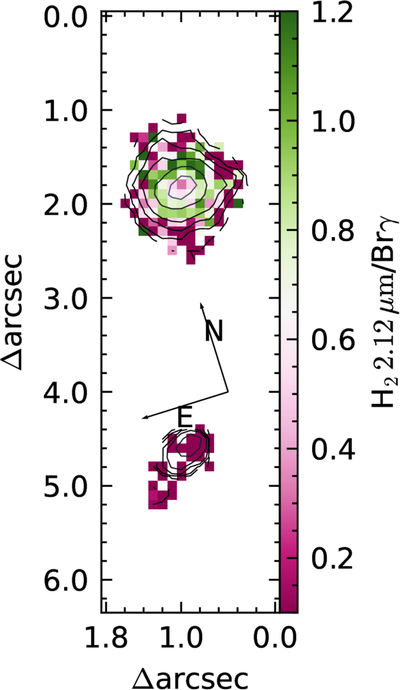
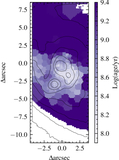
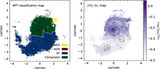
Caption: Figure 11.
Line-ratio map made from OSIRIS-AO observation, covering objects 1 and 3. Object 3 is surrounded by spaxels that can be formally classified as AGN (H2/Brγ > 0.6, indicated with green color). The contour shows the flux level of H2 1−0 S(1) emission.
Other Images in This Article
Show More
Copyright and Terms & Conditions
© 2026. The Author(s). Published by the American Astronomical Society.
Copyright ©
2026 Astronomy Image Explorer. All Rights Reserved.