Image Details
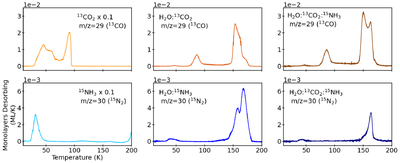
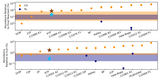
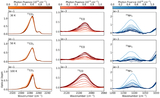
Caption: Figure 3.
The TPD of 13CO (m/z = 29 top row) and 15N2 (m/z = 30 bottom row) following UV irradiation of various ices at 10 K. Left column: primary ices. Middle column: water-rich binary ices. Right column: water-rich ternary ices. Note that the high-temperature peak around 200 K in some TPD traces (bottom left panel) are presumed to correspond to either codesorption of hypervolatiles with ammonium salts or desorption from another part of the chamber. These peaks are not included in the abundance calculation to avoid overreporting. Some of the TPD curves have been scaled for readability, which is listed on the individual panel.
Other Images in This Article
Show More
Copyright and Terms & Conditions
© 2026. The Author(s). Published by the American Astronomical Society.