Image Details
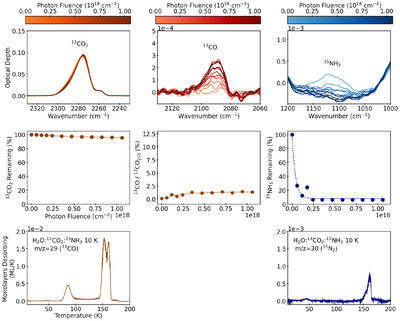
Caption: Figure 16.
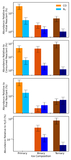
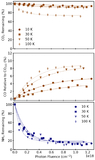
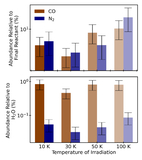
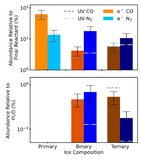
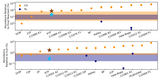
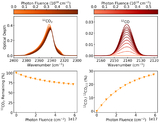
Top panels: variation of the IR features throughout irradiation of a NH3-poor ternary ice. Middle panels: CO2 destruction, CO formation, and NH3 destruction curves. Lower panels: TPD curves used to measure the resulting N2 abundance.
Other Images in This Article
Show More
Copyright and Terms & Conditions
© 2026. The Author(s). Published by the American Astronomical Society.
Copyright ©
2026 Astronomy Image Explorer. All Rights Reserved.