Image Details
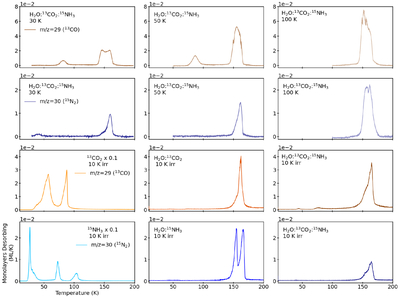
Caption: Figure 12.
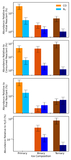
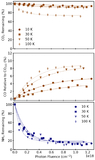
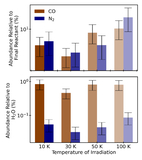
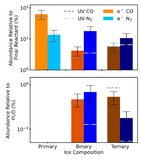
Top two rows: the temperature-programmed desorption (TPD) of 15N2 (m/z = 30) and 13CO (m/z = 29). From left to right: 30 K irradiation; 50 K irradiation; 100 K irradiation. Bottom two rows: the TPD of 13CO (m/z = 29; top) and of 15N2 (m/z = 30; bottom) following electron bombardment. From left to right: primary, binary, ternary. Note that, for the two primary electron bombardment experiments, y-axis is scaled by a factor of 0.1.
Other Images in This Article
Show More
Copyright and Terms & Conditions
© 2026. The Author(s). Published by the American Astronomical Society.
Copyright ©
2026 Astronomy Image Explorer. All Rights Reserved.