Image Details
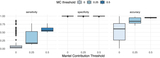
Caption: Figure A2.
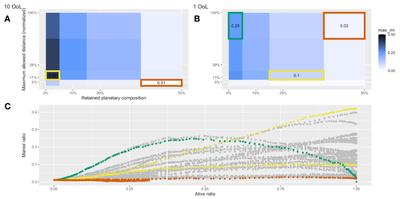
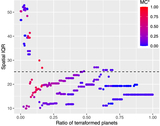
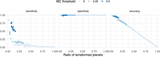
The impact of model parameter changes on the Mantel coefficient. Examples correspond to “flat” (orange), “increasing than decreasing” (green), and “mostly increasing” (yellow). Panels (a) and (b) show heatmaps for the maximum Mantel coefficient reached when varying the amount of planetary composition retained by the terraformed planet after terraforming (x-axis) and varying the maximum allowed distance for planet target selection (y-axis), for scenarios with 1 OoL (panel (a)) and 10 OoL (panel (b)). (c) The Mantel coefficient across different scenarios as a function of the terraformed planet ratio (x-axis).
Other Images in This Article
Show More
Copyright and Terms & Conditions
© 2026. The Author(s). Published by the American Astronomical Society.