Image Details
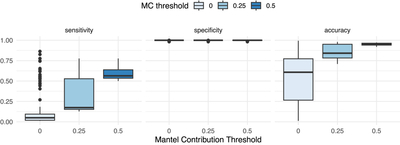
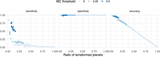
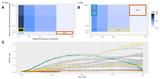
Caption: Figure 8.
Summary evaluation metrics of sensitivity, specificity, and accuracy for our selected clusters, grouped by MC threshold. From left to right, boxes within plots correspond to raising the MC threshold used for selection (left: MC = 0; middle: MC = 0.25; right: MC = 0.5).
Other Images in This Article
Show More
Copyright and Terms & Conditions
© 2026. The Author(s). Published by the American Astronomical Society.
Copyright ©
2026 Astronomy Image Explorer. All Rights Reserved.