Image Details
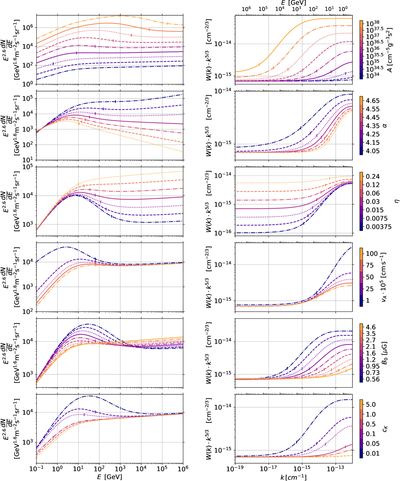
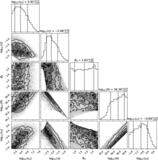
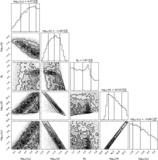
Caption: Figure 3.
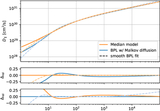
Kolmogorov. We vary the model parameters around the default parameter set (as specified in Figure 2), one in each row, while keeping the rest fixed. Line styles change from dashed–dotted, to dashed, to dotted, to solid with increasing parameter value. The energies for the right plots are derived as ﹩E=(\sqrt{1+{(q{B}_{0}/(km{c}^{2}))}^{2}}-1)m{c}^{2}﹩, except for the second-to-last row, where we varied B0. The expected breaks according to Equation (16) are denoted by small vertical lines.
Other Images in This Article
Copyright and Terms & Conditions
© 2026. The Author(s). Published by the American Astronomical Society.
Copyright ©
2026 Astronomy Image Explorer. All Rights Reserved.