Image Details
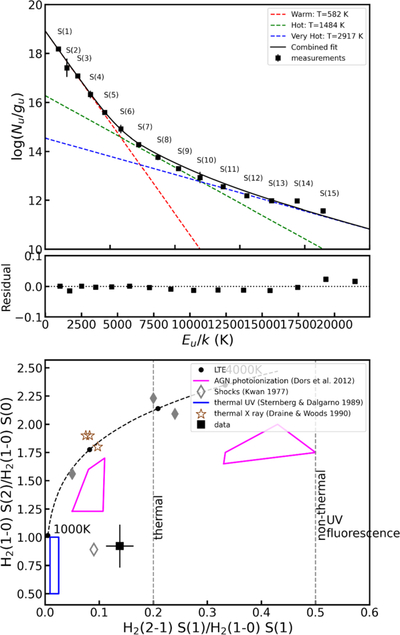
Caption: Figure 5.
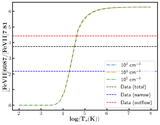
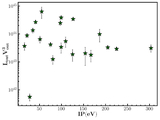
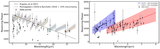
Upper panel: rotational excitation diagram of the pure molecular hydrogen emission lines. The solid lines indicate the best-fit models, while the points represent the observed data. The residual panels show the normalized residuals, defined as (data−model)/data. Lower panel: Lower panel: excitation diagram of the H2 rovibrational line ratios, H2(2–1) S(1)/H2(1–0) S(1) vs. H2(1–0) S(2)/H2(1–0) S(0). Ratios with H2(2–1) S(1)/H2(1–0) S(1) ≲0.2 indicate predominantly thermal excitation, while ratios ≳0.5 are characteristic of nonthermal excitation dominated by UV fluorescence (H. Mouri 1994). The black points connected by dotted lines represent LTE predictions for temperatures between 1000 and 4000 K (R. A. Riffel 2021). The pink shaded region corresponds to AGN photoionization (O. L. Dors et al. 2012), the gray diamond symbols mark shock-excited regions (J. H. Kwan et al. 1977; M. D. Smith 1995), and the blue shaded region denotes thermal UV excitation (A. Sternberg & A. Dalgarno 1989). The brown star symbols indicate thermal X-ray excitation (B. T. Draine & D. T. Woods 1990). The solid black square with error bars represents the measured line ratios for NGC 4395.
Other Images in This Article
Show More
Copyright and Terms & Conditions
© 2026. The Author(s). Published by the American Astronomical Society.