Image Details
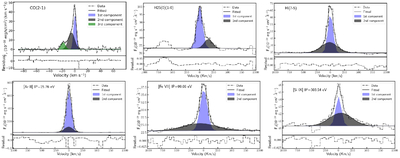
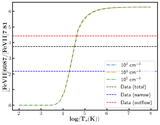
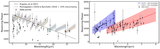
Caption: Figure 6.
Visualization of outflows across multiple ionized gas phases: top panels show cold molecular gas (top left), hot molecular gas (top middle), and neutral HI gas (top right). The bottom panel illustrates ionized outflows traced by different elements spanning a range of ionization states, from low (left) to highly ionized gas (right). Corresponding spectral lines and IP are indicated in each panel.
Other Images in This Article
Show More
Copyright and Terms & Conditions
© 2026. The Author(s). Published by the American Astronomical Society.
Copyright ©
2026 Astronomy Image Explorer. All Rights Reserved.