Image Details
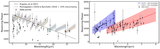
Caption: Figure 1.
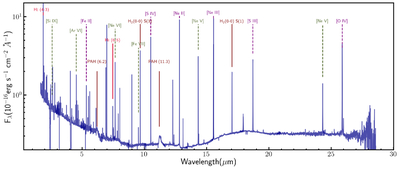
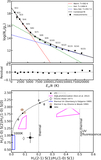
Aperture-corrected nuclear spectrum of NGC 4395, extracted from the central region, spans the rest-frame wavelength range 1.66–28.6 μm, combining observations from JWST/NIRSpec and MIRI Channels 1–4. Some of the prominent emission lines are indicated along the spectrum. Molecular features, including PAH and H2 lines, together with HI recombination lines, are shown by solid lines, while ionized gas lines are denoted by dashed lines. Low-ionization species (e.g., [Fe II], [Ne II], [S III], [O IV]) are marked in purple, whereas high-ionization lines are indicated in dark green.
(The data used to create this figure are available in the online article.)
(The data used to create this figure are available.)
Other Images in This Article
Show More
Copyright and Terms & Conditions
© 2026. The Author(s). Published by the American Astronomical Society.