Image Details
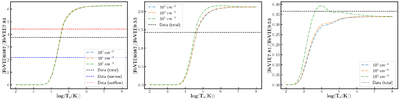
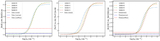
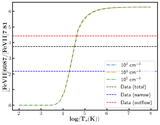
Caption: Figure B2.
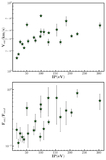
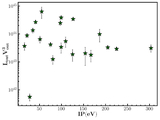
Variation in different line ratios with electron temperature for different particular electron densities, which represent different curves in each plot, and are denoted by individual legends in each plot. The horizontal line in each plot represents the observed line ratio.
Other Images in This Article
Show More
Copyright and Terms & Conditions
© 2026. The Author(s). Published by the American Astronomical Society.
Copyright ©
2026 Astronomy Image Explorer. All Rights Reserved.