Image Details
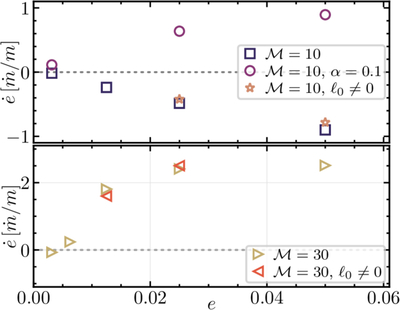
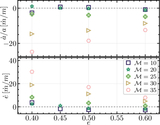
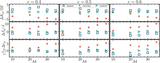
Caption: Figure 10.
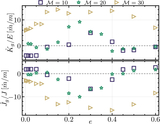
The rate of change of binary eccentricity for nearly circular binaries. The top panel plots the results for ﹩{ \mathcal M }=10﹩ disks and the bottom for ﹩{ \mathcal M }=30﹩ disks. Squares in the top panel and right-pointing triangles in the bottom panel plot the results using our fiducial viscosity (constant ν) and ℓ0 = 0 in Equation (19). Stars in the top panel and left-pointing triangles plot results with ℓ chosen to initiate each disk with its quasi-steady surface density profile (the value of ﹩\dot{J}/\dot{M}﹩ measured from an initial ℓ = 0 run; see the Appendix); whether or not each disk reaches a quasi-steady state is effectively irrelevant for ﹩\dot{e}﹩ near e ∼ 0, and seems to have no bearing on whether or not near-circular binaries are driven toward higher or lower eccentricities. In the top panel, circles plot the results from a pair of simulations using an ﹩\alpha =0.1﹩ viscosity; at ﹩{ \mathcal M }=10﹩, then, the viscosity prescription employed appears to determine the sign of ﹩\dot{e}﹩ at low but nonzero binary eccentricities. Unlike thicker disks, even with constant-ν viscosities, thin disks drive near-circular binaries to higher eccentricities.
Other Images in This Article
Show More
Copyright and Terms & Conditions
© 2026. The Author(s). Published by the American Astronomical Society.