Image Details
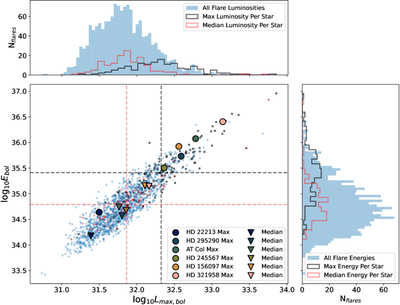
Caption: Figure 5.
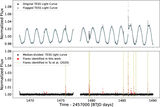
The bolometric energy plotted against the peak luminosity for each flare identified in the TESS light curves (blue circles). The median (red) and maximum (black) flare values for each star are also shown. Histograms for all flares, the median flare per star, and the maximum flare per star are provided in the top and right panels using the same colors, with the median values indicated by dashed lines in their respective colors. The median (triangles) and maximum (circles) flare values for the six VLASS-detected stars are also plotted.
Other Images in This Article
Copyright and Terms & Conditions
© 2026. The Author(s). Published by the American Astronomical Society.
Copyright ©
2026 Astronomy Image Explorer. All Rights Reserved.