Image Details
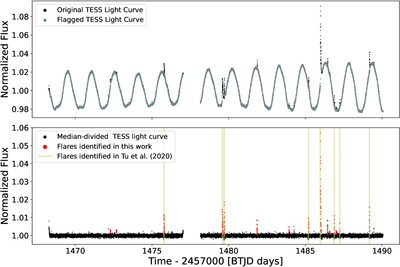
Caption: Figure 6.
The original SPOC light curve and the light curve with masked outlying points for HD 295290 (top) and the corresponding detrended light curve with the identified flares (bottom). Because Z.-L. Tu et al. (2020) provided the times for the flares they identified, the peak times of their flares are also included in the bottom plot. Our flare-identification framework identified 14 flares for HD 295290 compared to Z.-L. Tu et al.’s (2020) eight flares and L. Doyle et al.’s (2020) 16 flares. Many of the flares we detected that were not reported by Z.-L. Tu et al. (2020) may have been excluded from their analysis because they did not qualify as superflares based on their energy calculations.
Other Images in This Article
Copyright and Terms & Conditions
© 2026. The Author(s). Published by the American Astronomical Society.