Image Details
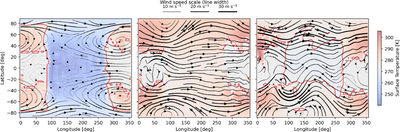
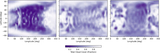
Caption: Figure 6.
Global wind velocity streamlines for the three topographic configurations. The black streamlines show the time-mean horizontal flow at 100 hPa, with line width proportional to wind speed (see the scale bar). The red contours outline the 273 K temperature curve. The panels show the Baseline (left), Steep Uplift (center), and Plateau (right) cases. In this regime, the Steep Uplift and Plateau cases exhibit intensified stationary waves and cross-terminator flow, while the Baseline yields a more zonally symmetric and weaker circulation.
Other Images in This Article
Copyright and Terms & Conditions
© 2026. The Author(s). Published by the American Astronomical Society.
Copyright ©
2026 Astronomy Image Explorer. All Rights Reserved.