Image Details
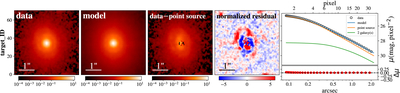
Caption: Figure 6.
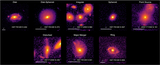
Example HST F125W galight results for GOODS-N ID 459 (visual classification: Irregular). The left panel shows the raw F125W data. The second panel shows the model of the source created by galight using the best-fit PSF. The third shows the data with a PS subtracted away, revealing the galaxy underneath. The fourth shows a normalized residual after subtracting the model from the data. The fifth shows the azimuthally averaged radial profiles for (a) the observed data, (b) the full galight model, which is the sum of (c) the PS and (d) bulge and disk component radial profiles (listed as “galaxy(s)” in the figure) showing that the model fits the data quite well, except for an excess from the underlying host galaxy. There is strong evidence for a spiral or ring-like structure under the PS, though the spiral arms are irregular and asymmetric.
Other Images in This Article
Show More
Copyright and Terms & Conditions
© 2026. The Author(s). Published by the American Astronomical Society.