Image Details
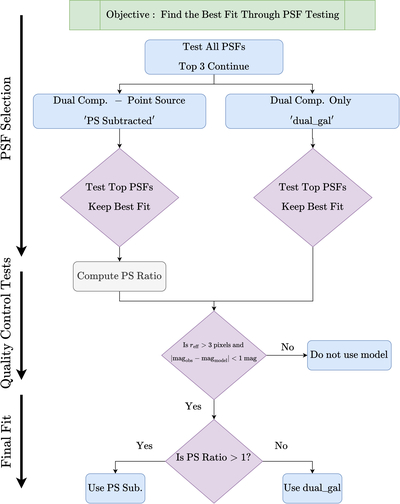
Caption: Figure 4.
Flow chart showing the process for iteratively choosing the best fit for a given galaxy. Through this process, we test multiple PSFs, choose the best PSF for a given source, and decide whether it is necessary to subtract a PS based on the ratio of light from the PS to light from the host galaxy. Colors correspond to different steps in the process. Blue denotes fitting steps, purple denotes selection steps, and beige computational steps.
Other Images in This Article
Show More
Copyright and Terms & Conditions
© 2026. The Author(s). Published by the American Astronomical Society.
Copyright ©
2026 Astronomy Image Explorer. All Rights Reserved.