Image Details
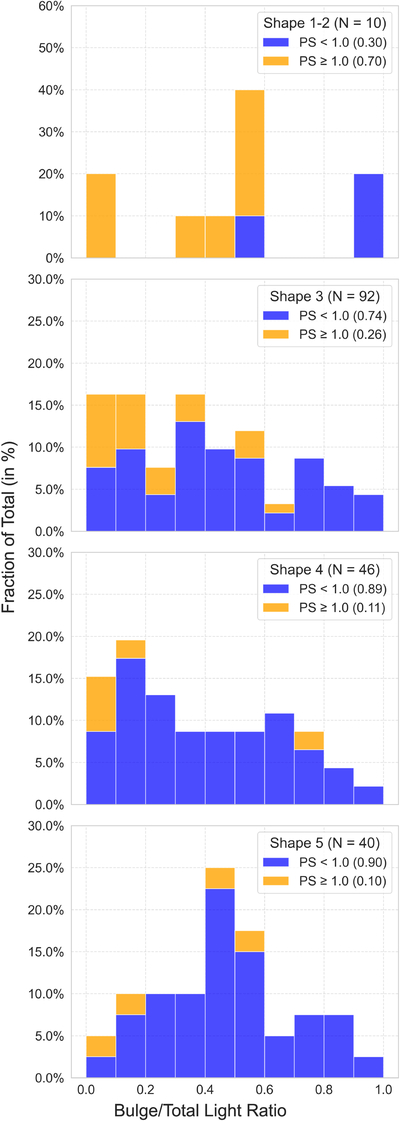
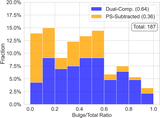
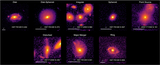
Caption: Figure 14.
B/T light ratios measured with galight, grouped by SED shape as defined in Table 2 and Figure 3. The fraction of sources above or below the PS ratio cut, PS = 1, is shown in parentheses. Shape 5 appears visually and statistically distinct from Shapes 3 and 4, as discussed in Section 4.2.
Other Images in This Article
Show More
Copyright and Terms & Conditions
© 2026. The Author(s). Published by the American Astronomical Society.
Copyright ©
2026 Astronomy Image Explorer. All Rights Reserved.