Image Details
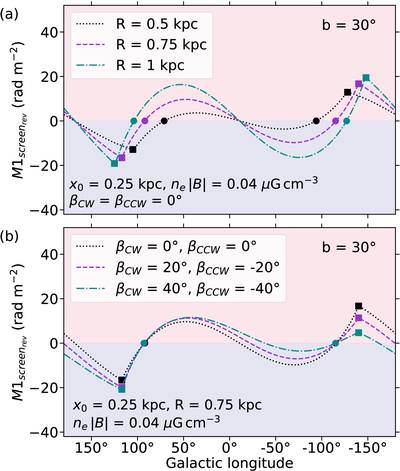
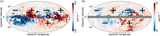
Caption: Figure 11.
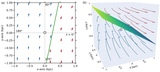
A demonstration of how changing the parameters of the planar reversal model adjusts the simulated ﹩{{\rm{M1}}}_{{{\rm{screen}}}_{{\rm{rev}}}}﹩ profiles for Galactic latitude b = 30°. Red and blue shading are included for quick visual identification of the positive and negative peaks. (a) Varying the path length, R, shifts the longitude of the zeros (circles) and peaks (squares) horizontally. (b) Varying the vertical tilt angles, βCW and βCCW, shifts the profiles vertically.
Other Images in This Article
Show More
Copyright and Terms & Conditions
© 2026. The Author(s). Published by the American Astronomical Society.
Copyright ©
2026 Astronomy Image Explorer. All Rights Reserved.