Image Details
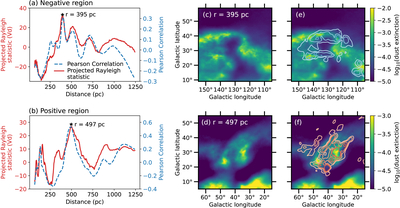
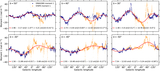
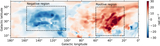
Caption: Figure 7.
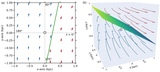
The results of comparing DRAGONS M1 for the two high-Faraday-depth regions to dust at each distance in the E24 map using AstroHOG (J. D. Soler et al. 2019). In (a) and (b) selected statistics as a function of distance are plotted, with the projected Rayleigh statistic (Vd) in red and the Pearson correlation in blue. For both regions, Vd and the Pearson correlation coefficient peak at a preferred distance, marked with a star, and we include the dust map for that distance, with the same map plotted twice in the middle, (c) and (d), and right, (e) and (f), columns. The dust images in (e) and (f) have the DRAGONS M1 contours overlaid, with contours at ∣M1∣ = 15, 20, 25, and 30 rad m−2. The panels (c), (d), (e), and (f) approximately cover the regions shown with dashed lines in Figure 6.
Other Images in This Article
Show More
Copyright and Terms & Conditions
© 2026. The Author(s). Published by the American Astronomical Society.