Image Details
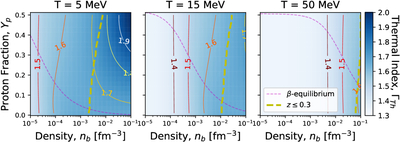
Caption: Figure 4.
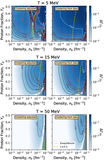
Density contour plot of the thermal index of npeγ matter as a function of baryon density nb and proton fraction Yp. The three panels correspond to temperatures T = 5, 15, and 50 MeV from left to right. Contours are displayed in steps of 0.1. The dashed violet line represents the β-equilibrium trajectory, while the yellow line indicates the constraint (zn, zp) ≤ 0.3. The virial approximation is valid to the left of this line.
Other Images in This Article
Copyright and Terms & Conditions
© 2025. The Author(s). Published by the American Astronomical Society.
Copyright ©
2025 Astronomy Image Explorer. All Rights Reserved.