Image Details
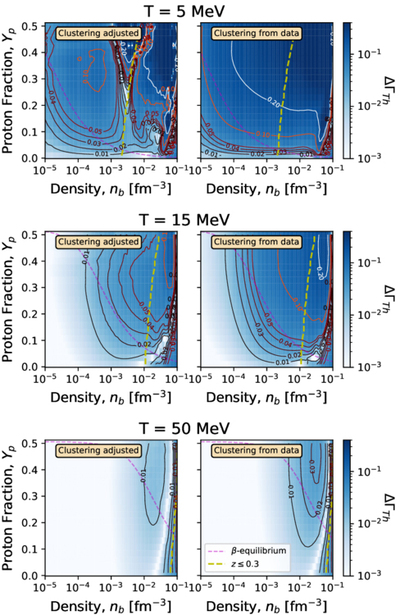
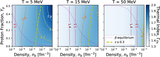
Caption: Figure 8.
Relative error of the virial thermal index compared to the average thermal index from database EOSs for temperatures T = 5 MeV (top), T = 15 MeV (central) and 50 MeV (bottom panels). The y-axis shows the proton fraction Yp, while the x-axis shows the baryon number density nb ranging from 10−5 to 10−1 fm−3. We show contour lines to guide the eye. The violet dashed line represents the β-equilibrium path, while the yellow line indicates the constraint (zn, zp) ≤ 0.3, as shown in Figure 4. Each panel depicts the complete EOS, incorporating contributions from leptons and photons. In the right panels, the virial expansion is directly compared to the database EOS, whereas in the left panels, the data are cluster adjusted as described in the main text.
Other Images in This Article
Copyright and Terms & Conditions
© 2025. The Author(s). Published by the American Astronomical Society.