Image Details
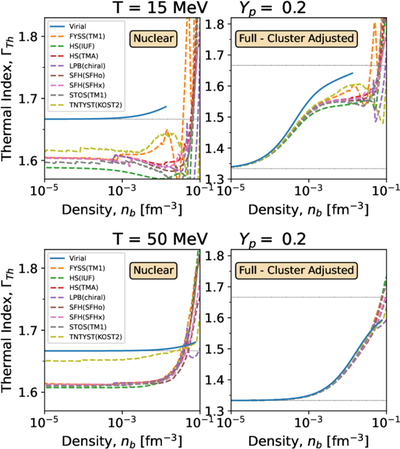
Caption: Figure 7.
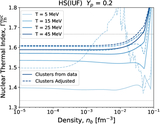
Thermal index Γth as a function of number density for our virial approximation (blue solid line) and several EOSs from CompOSE (dashed lines). The left and right panels display the nuclear thermal index (Equation (29)) and the full thermal index (Equation (24)), respectively, for a proton fraction Yp = 0.2 and at a temperature of T = 15 MeV (top) and at a temperature of T = 50 MeV (bottom). Note the different scales in the y-axis of the left and right panels. Horizontal dotted lines represent the values of Γth in both the relativistic and nonrelativistic limits.
Other Images in This Article
Copyright and Terms & Conditions
© 2025. The Author(s). Published by the American Astronomical Society.
Copyright ©
2025 Astronomy Image Explorer. All Rights Reserved.