Image Details
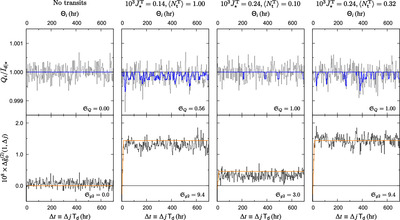
Caption: Figure 3.
Simulated TESS-like light curves of a sunlike star with IC-band apparent magnitude 12, with the estimator derived autocovariance g(2) functions. Here, the light curve has been sampled for a year (only partly shown) and then binned to ﹩{{\mathsf{T}}}_{{\mathsf{d}}}=3\,{\rm{hr}}﹩, about the timescale of a habitable zone transit, with resultant photon shot noise fluctuations ﹩{\sigma }_{J;{\mathfrak{n}}}\approx 0.00024﹩. The transits have a depth equal to ﹩{\bar{J}}_{\star }^{{\rm{T}}}﹩, occurring as a Poisson point process, appearing as the blue dips in the simulated photometry (top). As a result, when the depth and rate of the transits are high enough, a clear sign of their presence is the telltale bump in autocorrelation on the transit timescale. The null model on the left has no transits and no bump, despite fairly similar-looking photometry data. Line colors are the same as in Figure 1.
Other Images in This Article
Copyright and Terms & Conditions
© 2025. The Author(s). Published by the American Astronomical Society.