Image Details
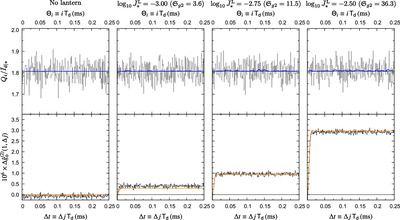
Caption: Figure 1.
Simulated microsecond photometry from a VERITAS-like array of a V⋆ = 8 sunlike star with a quasithermal lantern. The first quarter millisecond of photometry is shown on top (gray series), and the measured autocovariance ﹩{\rm{\Delta }}{\hat{g}}_{{\mathsf{o}}}^{(2)}﹩ difference on bottom (dark gray series). As the lantern’s brightness increases relative to the star, (tiny) fluctuations begin to appear in the underlying intensity curve (blue, top), with a telltale predicted signature in ﹩{Q}_{{\mathsf{o}}}﹩ (orange, bottom). Despite their miniscule amplitude, a clear detection is made for ﹩{\bar{J}}_{\star }^{{\rm{L}}}=1{0}^{-2.75}﹩ in ﹩{\rm{\Delta }}{\hat{g}}_{{\mathsf{o}}}^{(2)}﹩ (steep rise at Δj ∼ 1) after a minute of integration.
Other Images in This Article
Copyright and Terms & Conditions
© 2025. The Author(s). Published by the American Astronomical Society.