Image Details
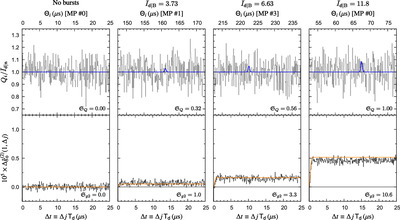
Caption: Figure 2.
Simulated submicrosecond data from a VERITAS-like array observing the Crab pulsar in a search for optical microbursts. The telescope records photon counts during each radio main pulse for an hour; a section of the counts for a pulse containing a burst is shown on top. The microbursts are visible in the underlying intensity curve (blue lines, top), but not detectable individually in the noisy background. By averaging the estimated autocorrelation function of about 100,000 pulses over an hour, a rise in the ﹩{\rm{\Delta }}{\hat{g}}_{{\mathsf{o}}}^{(2)}﹩ estimator demonstrates the bump in g(2) (bottom; dark gray for model data, orange for prediction), the signature of the microbursts.
Other Images in This Article
Copyright and Terms & Conditions
© 2025. The Author(s). Published by the American Astronomical Society.