Image Details
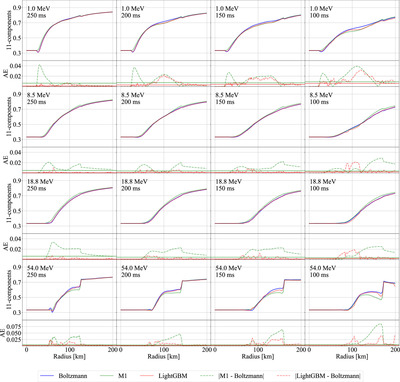
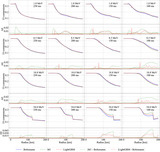
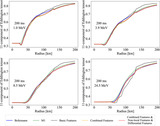
Caption: Figure 4.
Radial profiles of the k11 component of the Eddington tensor at θ = π/2. The horizontal axis represents the radius, and the vertical axis shows the k11 values. The blue, green, and red lines correspond to the Boltzmann–radiation–hydrodynamics simulations, the M1 closure relation, and the prediction obtained by LightGBM, respectively. The bottom panel shows the absolute values of the differences between the M1 and Boltzmann predictions as ∣M1 − Boltzmann∣ and those between the LightGBM and Boltzmann predictions as ∣LightGBM − Boltzmann∣, with solid lines indicating the mean errors.
Other Images in This Article

Copyright and Terms & Conditions
© 2025. The Author(s). Published by the American Astronomical Society.
Copyright ©
2026 Astronomy Image Explorer. All Rights Reserved.